

This post was originally published on this site.
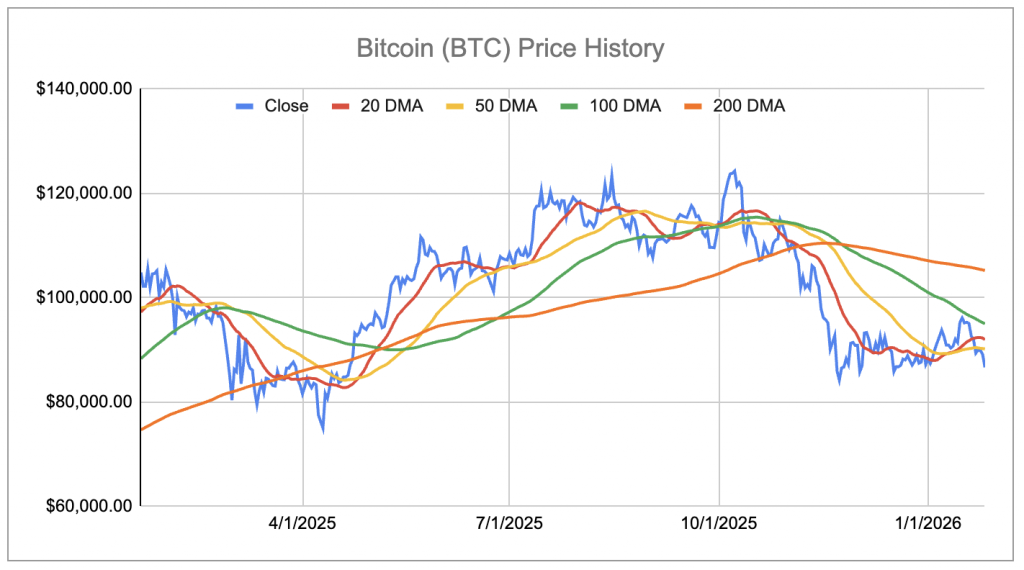
Bitcoin has crashed 25% over the last six months, now trading under $88,000. The fall stems from macroeconomic uncertainty, risk-off sentiment, and weakening institutional flows. After reaching record highs near $126,000 in late 2025, fading enthusiasm triggered a reversal. Leveraged trading amplified the decline—forced liquidations accelerated the selloff.
But where does this fall end?
Before we answer this, if you seek an upside with less volatility than holding an individual stock or cryptocurrency like Bitcoin, consider the High Quality Portfolio. It has comfortably outperformed its benchmark—a combination of the S&P 500, Russell, and S&P MidCap indexes—and has achieved returns exceeding 105% since its inception. Why is that? As a group, HQ Portfolio stocks provided better returns with less risk versus the benchmark index; less of a roller-coaster ride, as evident in HQ Portfolio performance metrics. Separately, see – Microsoft Stock Hands Over $350 Billion To Shareholders
Image by BUKBOY6788 BUK BOY6788 from Pixabay
What Could Drive Bitcoin Lower?
- Are institutions abandoning Bitcoin? Yes, and it’s accelerating. U.S. spot Bitcoin ETFs saw $4.57 billion in outflows through November-December 2025—their worst two-month stretch on record. The week ending January 23, 2026, brought $1.33 billion in outflows, the largest weekly redemption since February 2025. BlackRock’s IBIT and Fidelity’s FBTC led the exits. This is structural de-risking, not temporary profit-taking.
- What do the technicals say? Bitcoin trades below its 365-day moving average near $101,000. A bearish Kumo twist appeared on the weekly chart—historically a bear market signal. Price is stuck between $85,000-$92,000, with selling pressure at every rally attempt. Momentum is dying.
- Why does macro uncertainty matter? Bitcoin now moves as a high-beta tech asset, not a safe haven. When risk appetite weakens, Bitcoin falls with equities. The Fed’s cautious stance on rate cuts, a strong dollar, and stretched valuations all create headwinds.
- What does on-chain data show? Sophisticated investors holding 100-1,000 Bitcoin are exiting. This cohort showed similar behavior in late 2021 before the deep 2022 drawdown. When smart money distributes at elevated prices, it signals expectations of lower returns ahead.
How Low Can Bitcoin Go?
CryptoQuant sees medium-term downside toward $70,000, with a deeper pullback potentially reaching $56,000—Bitcoin’s realized price where bear markets historically bottom. More extreme scenarios exist: veteran trader Peter Brandt suggests an 80% drawdown could reach $25,000, while Bloomberg’s Mike McGlone warns of $10,000. These require catastrophic conditions—hard economic landing, major policy errors, or complete institutional abandonment. They’re tail risks, not base cases.
The October 2025 leverage flush already happened—$20 billion in liquidations. Futures open interest is down 40% from the peak. The deleveraging is complete, reducing crash risk but making the market more sensitive to institutional flows.
Historical Precedence
- May 2021: Bitcoin fell around 50% from $58,000 to $30,000 due to Tesla’s Bitcoin reversal, China’s mining crackdown, and environmental concerns. Recovery took 6 months—Bitcoin hit new all-time highs of over $68,000 by November 2021.
- November 2021: The most severe drawdown. Bitcoin crashed 78% from around $69,000 to under $16,000 by November 2022. Recovery took 28 months, reaching $68,000 again in March 2024, driven by spot Bitcoin ETF approvals.
- May-November 2022: Bitcoin fell 50% from around $32,000 to under $16,000. As part of the broader 2022 bear market, it took 16 months to recover past the May 2022 level.
The pattern? Sharp 40-50% corrections recover in 6-16 months. Deep 70-80% bear markets take 24-28 months. The current situation shares traits with both—not as severe as 2022’s 77% crash, but the institutional de-risking mirrors that period’s structural challenges.
Potential Recovery
- When could flows reverse? Jerome Powell’s Fed tenure ends in May 2026. Markets expect a dovish replacement, which could improve liquidity and bolster Bitcoin demand. The Clarity Act, expected early 2026, could unlock $50 billion in institutional inflows by mid-2026 through regulatory clarity.
- Is the supply-demand favorable? Yes, structurally. Long-term holders resumed accumulation after three months of distribution. Corporate treasuries continue buying through volatility. Despite turbulence, U.S. spot Bitcoin ETFs attracted over $20 billion in 2025 total flows, with around $120 billion in assets under management. The infrastructure for renewed accumulation exists—it needs a catalyst.
- What are realistic recovery targets? Conservative forecasts: $120,000-$170,000 by end-2026, assuming ETF flows stabilize and macro conditions improve. Carol Alexander expects Bitcoin in a “high-volatility range” of $75,000-$150,000, centered around $110,000. Bullish scenarios could reach $200,000-$250,000 but require sustained ETF inflows, dovish Fed policy, and no regulatory shocks.
- How fast could recovery happen? ETF outflow spikes often mark local bottoms. Current weekly outflows match November 2025’s pattern, when Bitcoin bottomed around $80,000 before quickly recovering above $90,000. The average ETF investor cost basis sits at $84,099—a key support level. If Bitcoin holds here, selling pressure may exhaust, setting up a Q2 2026 recovery.
Bottom Line
Bitcoin’s decline isn’t finished. Near-term path leads toward $70,000-$75,000, with $56,000 possible if ETF outflows continue. Below $50,000 requires catastrophic scenarios—low probability given spot ETF infrastructure, corporate adoption, and regulatory progress.
Recovery depends on macro catalysts. A dovish Fed pivot after May 2026 could stabilize conditions by Q2-Q3. Regulatory clarity would restore institutional confidence. History suggests a 12-18 month recovery toward $120,000-$150,000 is achievable if these materialize.
If institutional flows stay negative and liquidity tightens, Bitcoin spends 2026 consolidating between $70,000-$100,000, pushing real recovery into 2027.
The market has changed. Bitcoin moves with institutional capital now. The deleveraging is done. The question isn’t whether Bitcoin recovers—it’s when institutional money returns.
Remember, investing in a single stock or other assets like cryptocurrency without comprehensive analysis can be risky. Consider the Trefis Reinforced Value (RV) Portfolio, which has outperformed its all-cap stocks benchmark (combination of the S&P 500, S&P mid-cap, and Russell 2000 benchmark indices) to produce strong returns for investors. Why is that? The quarterly rebalanced mix of large-, mid-, and small-cap RV Portfolio stocks provided a responsive way to make the most of upbeat market conditions while limiting losses when markets head south, as detailed in RV Portfolio performance metrics.
Invest with Trefis Market-Beating Portfolios
See all Trefis Price Estimates