
This post was originally published on this site.
By Eliezer Ndinga and Karim AbdelMawla
Bitcoin and crypto markets just had a rough few weeks. Prices fell sharply, liquidity tightened, and leverage got wrung out of the system. Now the question is whether this was a structural break or a necessary reset.
There are two ways to read what happened. The bearish case says the infrastructure is cracking, users are leaving, and capital is rotating out for good. The bullish case says this was overleveraged positioning meeting broader macro volatility, not a crypto-specific meltdown.
We lean toward the second view. The plumbing worked, settlement didn’t fail, and usage didn’t collapse. What collapsed was speculative froth that, frankly, needed to go. That said, conditions are fragile, and negative sentiment hasn’t turned.
This note looks at both sides: where the structural case for crypto still holds, and where real headwinds are creating drag.
Prices fell, but usage didn’t
If crypto were structurally impaired, we would expect usage and economic activity to deteriorate. That did not occur.
Despite many of the top 100 large-cap digital assets declining 30-50% over the past six weeks, sustained network engagement strengthened across major blockchains. The 30-day moving average of daily active users on Ethereum rose by around 64%, while on Solana it increased by nearly 27%.1 A rising 30-day moving average reflects persistent participation, not short-lived speculation.
Protocol-level economics also held up, which reflects leverage compression, not economic collapse. Across the top 20 revenue-generating protocols:
- Average daily revenue increased from ~$35.6 million in January to ~$42.1 million in early February (+18%).
- Revenue floors held above ~$30 million per day.
- Peak daily revenue reached ~$77 million2.
A more mature volatility regime
The recent sell-off was rough, but it occurred in a structurally different environment than prior cycles. Bitcoin’s realized volatility tells the story: During peak stress, seven-day realized volatility reached ~156%. To put this figure in perspective, Bitcoin’s realized volatility peaked near ~385% in the beginning of the COVID pandemic in March 2020.
More importantly, the structural backdrop was significantly calmer:
- 30 days prior to the February 5 event, 1-year realized volatility was ~41%.
- Pre-COVID levels were ~68%, at the same time frame.
- Pre-2022 Luna crash levels were ~74%3.
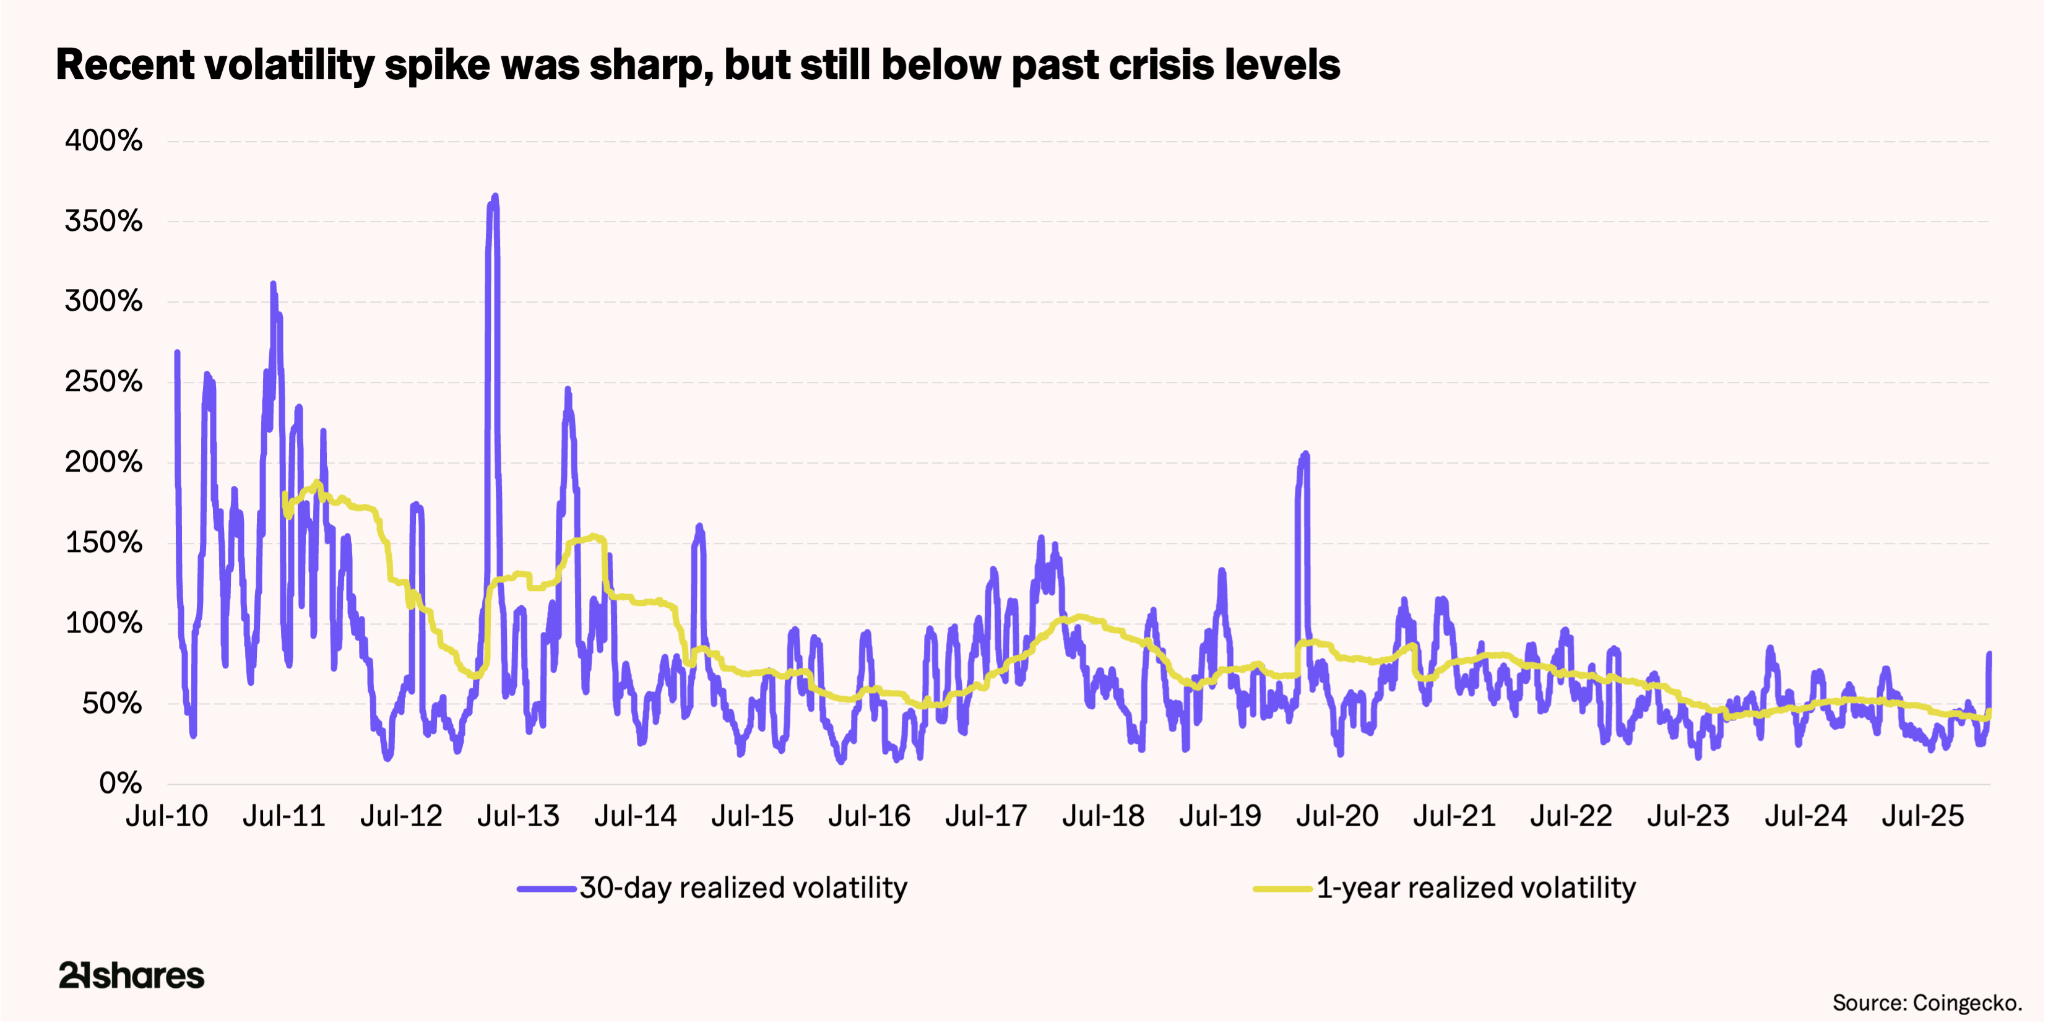
Since 2018, the 1-year realized volatility has dropped by 6% while the 30-day realized volatility trended lower by roughly 5% annually.
This suggests that while short-term shocks happened, the broader market structure is more stable than in prior regimes.
Capital reorganized, but it didn’t disappear
The stress window reflects reallocation, not withdrawal. Liquidity remained within the blockchain ecosystem, even as participation shifted and risk exposure decreased.
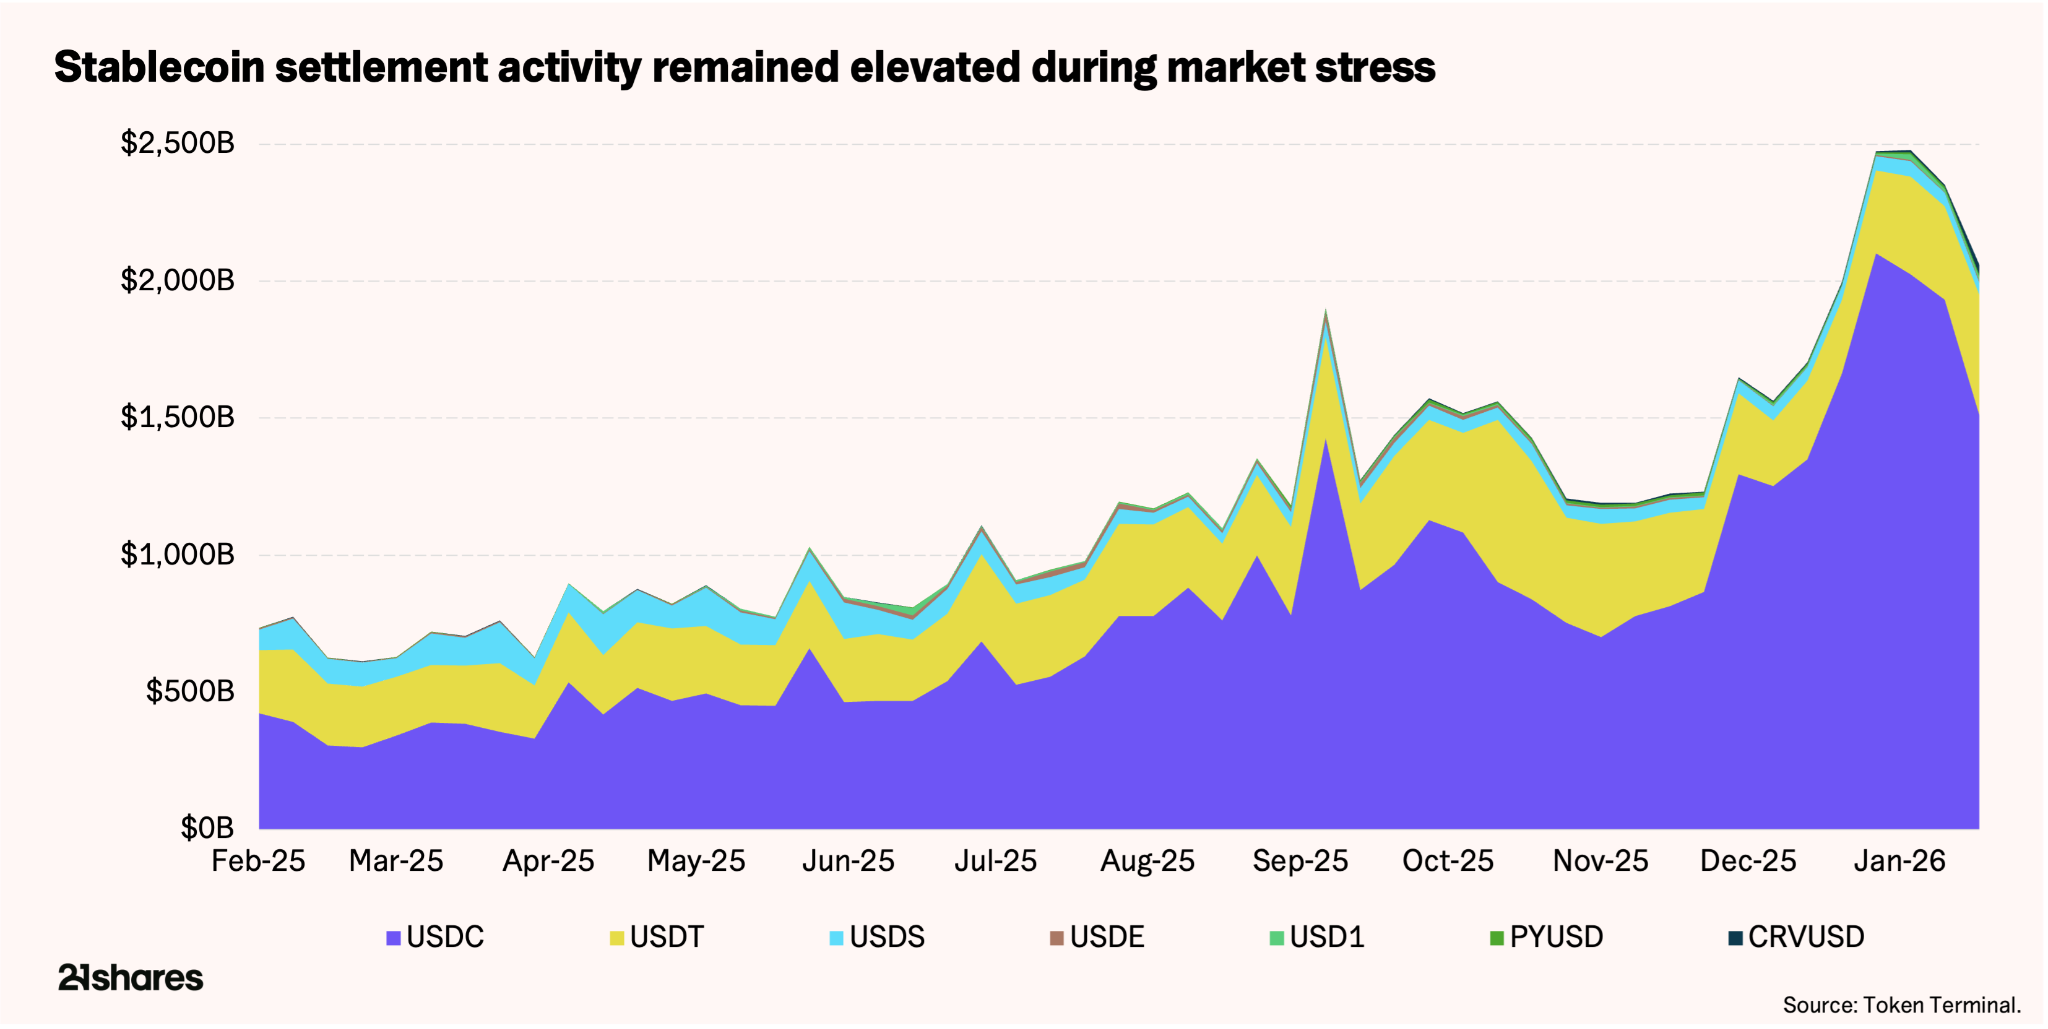
Stablecoins provide the clearest signal. In a true capital flight, total supply would contract persistently as investors redeem their holdings for fiat. Instead:
- Total stablecoin supply declined by only ~2% during peak stress (from $293.5 billion to ~$292 billion) around mid-January.
- Supply recovered to ~$293.9 billion by the end of the 30-day window, to slightly grow by 0.14%4.
Operationally, stablecoins continued to function as intended. Peg stability was maintained throughout the volatility, and USDT processed over ~$1.9 trillion5 in transfer volume over the past 30 days, including during peak stress.
More importantly, the composition of activity shifted materially when we look at the usage of the second-largest stablecoin, USDC. Comparing the 30 days before stress (between December 10 and January 10) with the stress window (between January 10 and February 10):
- Retail share fell from 21.7% to 12.6% (–9.1%).
- Small institutional share fell from 34.6% to 24.2% (–10.4%).
- Medium institutional share remained stable (~15%).
- Large institutional share increased from 28.1% to 48.0% (+19.9%)6.
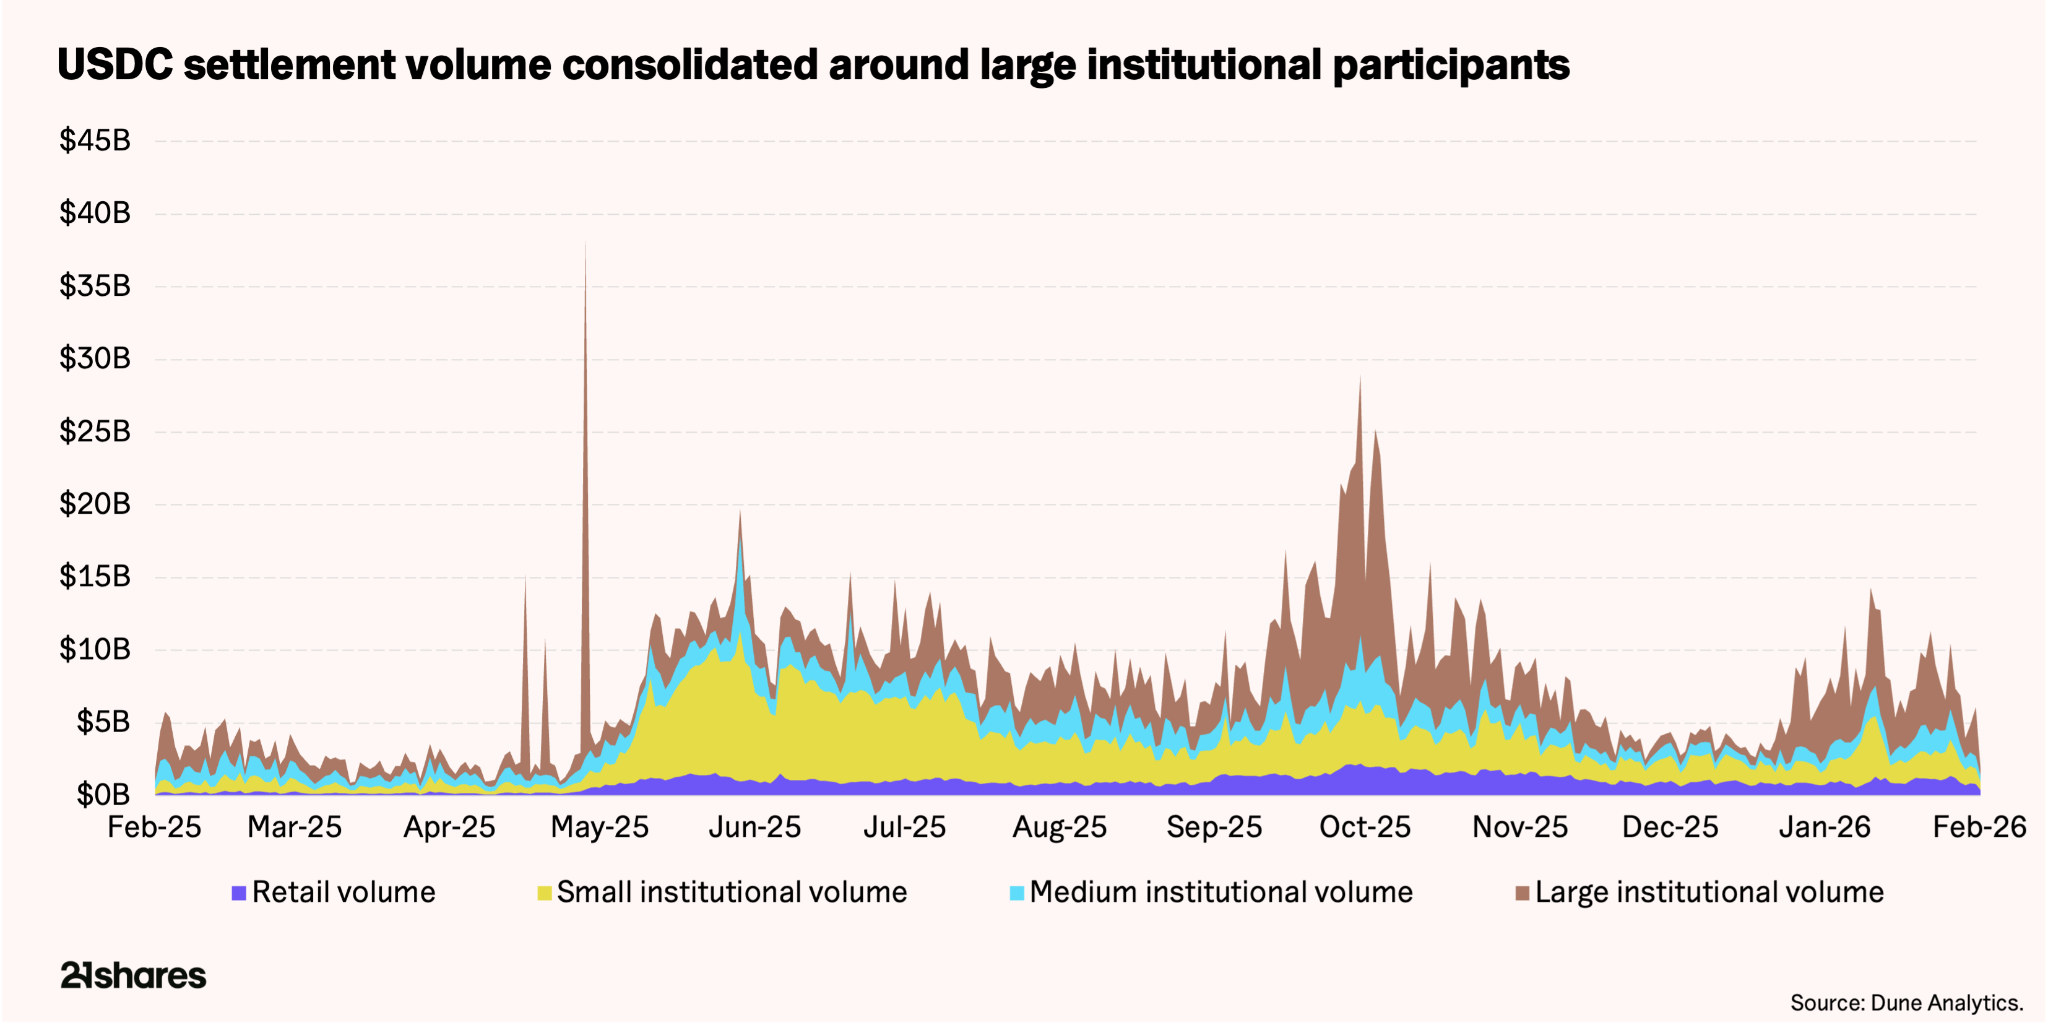
Nearly half of all stablecoin settlement volume during peak stress came from large institutional-sized transfers.
The same pattern appears in regulated vehicles. Since mid-December, US spot Bitcoin ETFs have recorded net outflows of $3.1 billion. However, flows were volatile rather than persistently directional:
- Average daily net flow: –$53 million.
- Typical daily flow magnitude: ~$296 million.
- Largest single-day outflow: −$2.49 billion.
- Largest single-day inflow: +$2.72 billion7.
Large redemptions were frequently followed by large inflows. This is consistent with tactical rebalancing in response to macro developments, not structural abandonment.
In DeFi lending, outstanding loans declined ~16% (from ~$37 billion to ~$31 billion). Importantly, the pullback was not uniform. The contraction was concentrated in higher-risk venues, while more established platforms demonstrated relative resilience:
- Maple Finance: Loan growth increased by 8%.
- Jupiter Lend: A decrease of 5%.
- Morpho: Experienced a reduction of 14%.
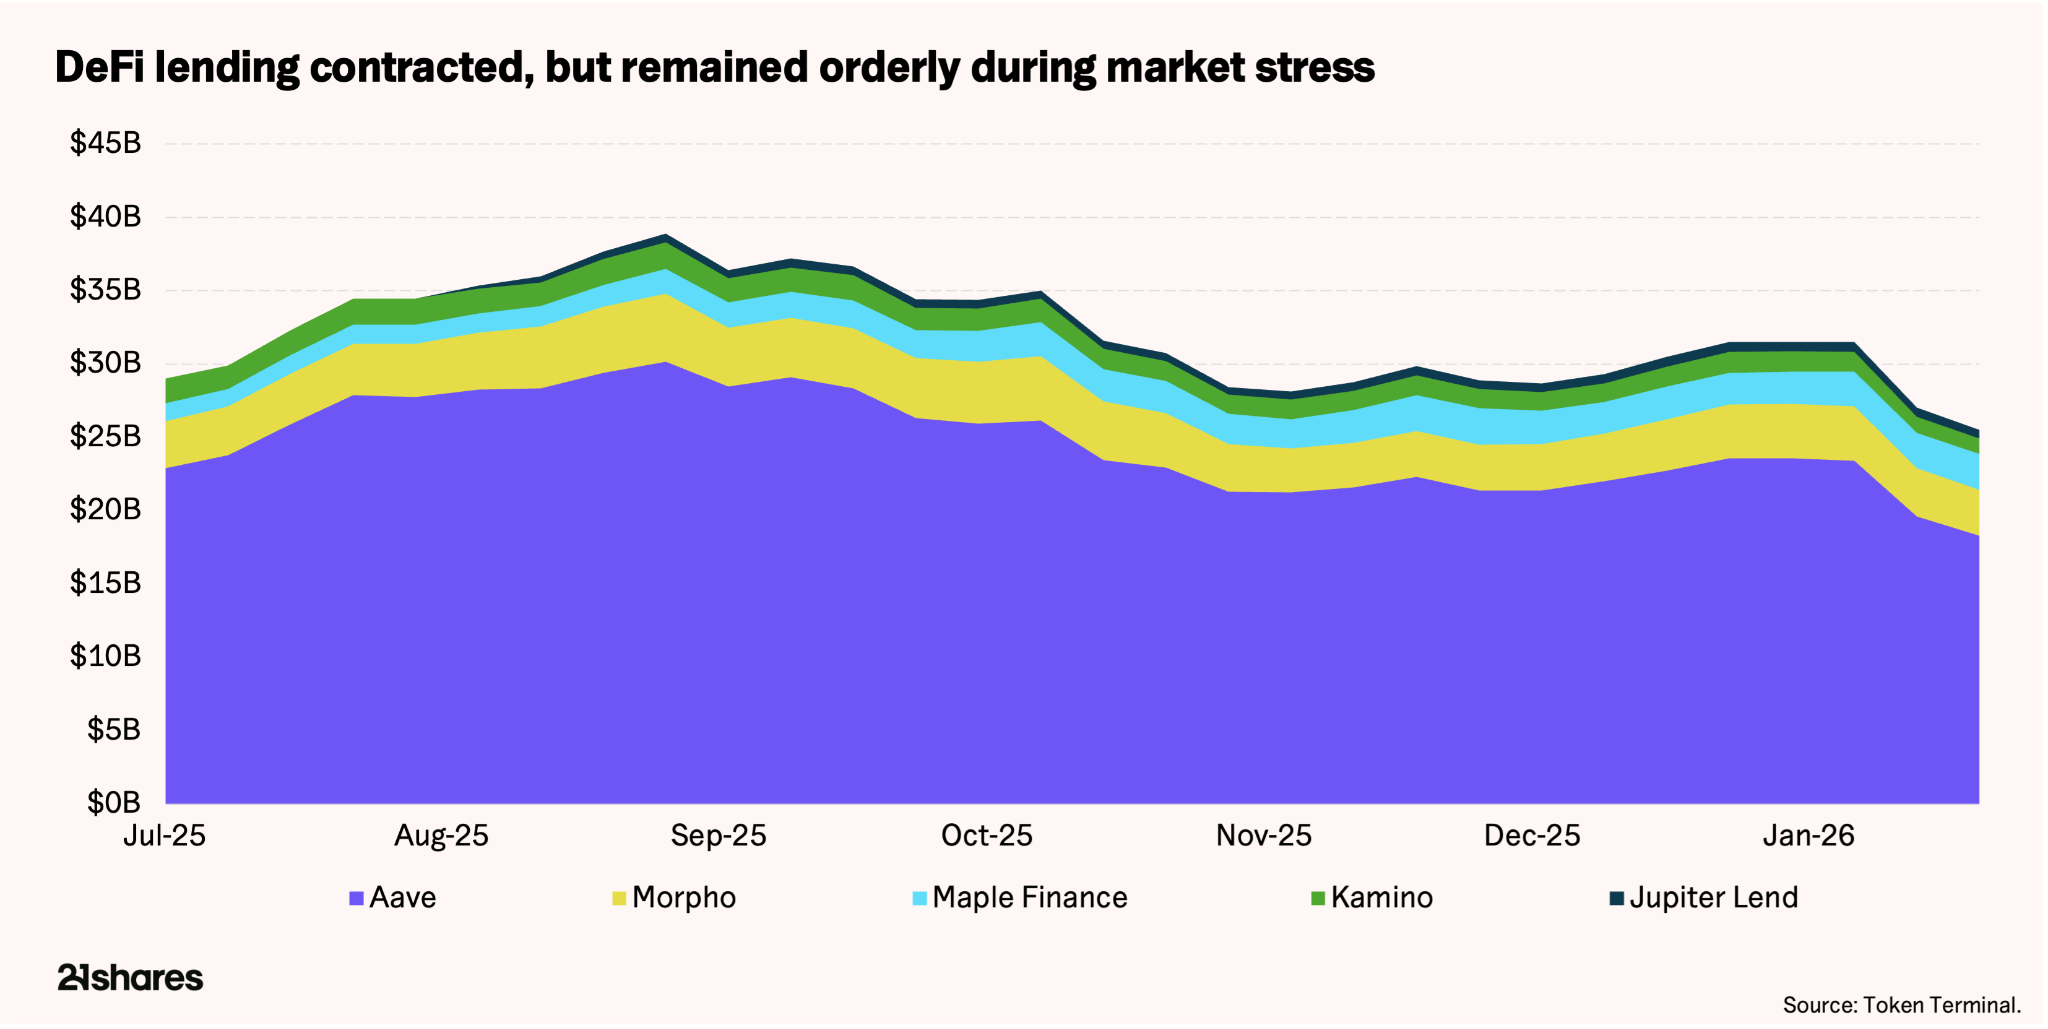
The dispersion suggests selective deleveraging and risk-tiering rather than broad-based credit stress.
Where the system was tested and endured
In a deleveraging event, the real question is not whether prices fall; it is whether risk can be cleared without damaging liquidity.
During the January-February stress window, roughly one-third of Bitcoin futures leverage was unwound as open interest declined by 34.6% from ~$36.2 billion to ~$23.7 billion8.
Funding rates show how that reset unfolded. Perpetual funding flipped from positive (+0.009%) to negative (−0.007%) at peak stress, signaling long-side pressure. But the imbalance normalized within a day. In structurally fragile markets, funding dislocations linger. Here, excess leverage was absorbed quickly.
Namely, on February 5, the bulk of the adjustment moved through derivatives venues:
- Perpetual futures volume reached ~$120.1 billion.
- Spot volume reached ~$29 billion.
- Perpetual-to-spot ratio: ~4.14x9.
For context, this ratio is:
- In line with Q4 2024 levels (~4.0x), the pre-US election positioning regime.
- Dramatically above May 2022 (~0.11x) and November 2022 (~0.03x), when spot dominated during systemic stress surrounding Luna and FTX’s collapse.
In other words, the recent sell-off reflects a derivatives-led leverage reset, not a spot-driven capital exit typical of structural breakdowns.
In the same vein, non-custodial liquidation infrastructure processed scale without destabilization:
- Aave processed ~$450 million in liquidations10.
- Morpho processed ~$100 million11.
- Bad debt remained negligible.
Derivatives venues also absorbed significant flow. Hyperliquid recorded ~$24.7 billion12 in daily volume on February 5, a level only exceeded during the historic market liquidation event of October 10, 2025, which was the largest in crypto history.
The market absorbed an important deleveraging event without systemic failure. But short-term resilience doesn’t answer the longer-term question: what do Bitcoin and crypto have to grow into from here?
The answer depends on factors beyond blockchain performance metrics. It depends on where capital flows, where attention goes, and whether the regulatory and geopolitical environment creates tailwinds or headwinds. On that front, the picture is mixed.
Headwinds
A new era is upon us. Crypto is no longer the shiny new toy. Narrative gravity, capital, and talent have shifted toward artificial intelligence and other frontier technologies. In a short-attention-span economy, attention is oxygen, and AI is breathing most of it. Capital is adapting accordingly. The bar is rising, and it will keep rising, especially compared with AI and other verticals that deliver immediate real-world utility.
The macro and geopolitical backdrop is also tightening. China, the world’s second-largest economy, banned Bitcoin trading and mining in September 2021 – a move 21shares had predicted13 in 2020 – while simultaneously accelerating its gold accumulation. Chinese gold ETFs surged over 240%, ending 2025 as the best year ever14. This policy divergence matters. The world’s second-largest economy, structurally shut out from Bitcoin exposure, creates a persistent demand overhang. It reinforces a fragmented regulatory landscape and underscores that digital assets remain politically contested despite Bitcoin operating on a global, permissionless infrastructure.
Meanwhile, the US Strategic Bitcoin Reserve relies entirely on seized assets, not market purchases, providing no incremental buying pressure to offset this structural headwind.
The case for conviction
Inside the crypto market, the cycle is maturing. The speculative premium is compressing, and the easy narratives like memes or NFTs are behind us. History shows Bitcoin bear markets come in two forms: cyclical drawdowns averaging 84% over two and a half years, and short-term corrections averaging 36% lasting two to three months15. The current environment reflects this maturation. As real businesses, both incumbents and credible upstarts, adopt blockchain infrastructure across payments, custody, settlement, and tokenization, expectations rise. As such, the technology is increasingly judged by financial services standards: reliability, compliance, security, and unit economics. In crypto, selective, fundamentals-based investing will be the only durable edge.
The silver lining is that this is exactly how long-term value is built. As froth recedes, infrastructure hardens, and a healthier cohort of builders and investors enters. We are transitioning from institutional readiness to fundamental investing, and the regulatory environment is finally shifting to match. The US is moving away from regulation by enforcement toward regulatory clarity. The Clarity Act and similar legislation signal a fundamental change: clear rules instead of ad hoc enforcement actions. This matters as much as the technology itself.
With roughly 700 million crypto users representing 10% of the internet population, the market mirrors internet adoption in 2003. Blockchains are moving from dial-up to broadband, processing 3,400 transactions per second and surpassing Stripe and Nasdaq’s peak processing speeds. DeFi is becoming Fintech 2.0 as firms like Stripe and Klarna adopt blockchain rails for payments and financial services. Consumer applications like Polymarket and Helium are quietly reinventing media and telecommunications with blockchain backends.
Hyperliquid, the blockchain-based derivatives exchange with nearly $1 billion in cumulative revenue and fewer than 20 employees, delivered a +20% year-to-date return, contrasting sharply with the broader market downturn, where the top 20 tokens by market capitalization declined 20%16.
In an environment where institutional actors position for monetary regime uncertainty, conviction is earned rather than assumed.
Footnotes:
- Token Terminal. (n.d.). Active Addresses Daily. Retrieved from https://tokenterminal.com/explorer/metrics/active-addresses-daily
- Token Terminal. (n.d.). Revenue. Retrieved from https://tokenterminal.com/explorer/metrics/revenue
- Glassnode Studio. (n.d.). Market Price (USD Close). Retrieved from https://studio.glassnode.com/charts/market.PriceUsdClose?a=BTC
- Token Terminal. (n.d.). Stablecoin Issuers. Retrieved from https://tokenterminal.com/explorer/markets/stablecoin-issuers
- Token Terminal. (n.d.). Stablecoin Transfer Volume. Retrieved from https://tokenterminal.com/explorer/metrics/stablecoin-transfer-volume
- Dune. (n.d.). Query 6684490. Retrieved from https://dune.com/queries/6684490/10528250
- Glassnode Studio. (n.d.). US Spot ETF Flows All. Retrieved from https://studio.glassnode.com/charts/institutions.UsSpotEtfFlowsAll?a=BTC
- Glassnode Studio. (n.d.). Futures Open Interest Sum. Retrieved from https://studio.glassnode.com/charts/derivatives.FuturesOpenInterestSum?a=BTC
- Glassnode Studio. (n.d.). Spot Volume Sum Intraday. Retrieved from https://studio.glassnode.com/charts/market.SpotVolumeSumIntraday?a=BTC&c=usd&chartStyle=column&mAvg=7&s=1606933738&u=1770768000&zoom=
- Morpho. (n.d.). Morpho Liquidation. Dune. Retrieved from https://dune.com/morpho/morpho-liquidation
- KARTOD. (n.d.). AAVE Liquidations. Dune. Retrieved from https://dune.com/KARTOD/AAVE-Liquidations
- Dune. (n.d.). Query 5810785. Retrieved from https://dune.com/queries/5810785/9414570
- elindinga. (2020, June 29). [Tweet about a status update]. X. Retrieved from https://x.com/elindinga/status/1277619464784224257?s=20
- World Gold Council. (2026, January). China Gold Market Update: December demand rebounds. Goldhub. Retrieved from https://www.gold.org/goldhub/gold-focus/2026/01/china-gold-market-update-december-demand-rebounds
- Ndinga, E. (n.d.). Eliezer Ndinga. LinkedIn. Retrieved from https://www.linkedin.com/in/eliezerndinga/details/featured/
- Messari. (n.d.). Assets. Retrieved from https://messari.io/assets