
This post was originally published on this site.
Capitalist society is structurally oriented towards the future. In Marx’s formulation, capital is the process of realizing the M-C-M’ circuit, wherein an initial investment (M) in commodity production (C) ultimately generates profit (M’). What it takes to realize some future M’ is naturally a question of intense speculation. Often, in the dogged pursuit of a particular future, we can get ahead of ourselves and inhabit that future as if it were already a reality. I suspect this is what’s behind the recent white-collar employee layoffs at Amazon and other tech companies: management is convinced that it can automate all manner of jobs, even if AI is not yet, and may never, be able to actually perform them. This naturally leaves the companies vulnerable to operational hiccups.
For most of the twenty-first century, it has been assumed that digital retail is the future, and that the brick-and-mortar retail experience is bound to steadily lose ground to the new portals of infinite choice and doorstep delivery. The prediction that such e-commerce companies will dominate the industry has shaped major investment decisions, and has far-reaching implications for worker organizing. But is this prediction correct?
Let’s start with the notion that e-commerce has a more profitable cost structure than traditional retail. The premier economic geographer of retail logistics systems Jean-Paul Rodrigue, of Texas A&M Galveston, has a chart on his site comparing the two that helpfully illustrates the differences. This is for a piece of apparel costing $150.
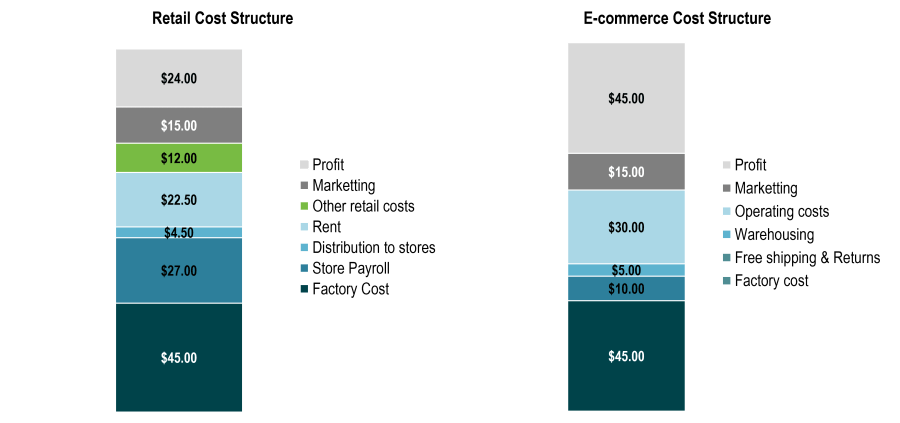
As this chart shows, traditional retailers have to pay for brick-and-mortar stores, ideally in desirable—more expensive—locations, and for the payroll of employees who work in those stores. Traditional retailers also necessarily keep more inventory on hand and have to have things like store signage, fixtures, etc. (these might be included in the “Other retail costs” category above). E-commerce companies, by contrast, can be lighter on inventory, and warehousing and transportation costs should be cheaper in more remote areas (which we often assume with e-commerce) than brick-and-mortar upkeep in town.
This is what we might call the “E-commerce Advantage” theory. From the consumer’s standpoint it’s a counter-intuitive one because, other things being equal, it should be cheaper to purchase something in a store than to pay for home delivery. The most expensive part of any package’s trip from manufacturer to final consumer is “last-mile” delivery, which traditional retail assumes the customer will cover. Yet proponents of the E-commerce Advantage counter that maintaining a brick-and-mortar store (rent, labor, inventory, upkeep, etc.) is costlier than warehousing and delivery.
Walmart v. Amazon
To test this proposition, we can assess those costs for the two most prominent examples of these abstractions: Walmart and Amazon. At first glance, comparing the two megaliths seems relatively simple. These are the two largest corporations in the United States by both revenue and workforce size. They are the two largest retailers by U.S. sales, with Walmart at $568.7 billion and Amazon at $273.66 billion (followed by Costco at $183.05 billion), according to the National Retail Federation. A few books have been written about the competition between them. Amazon pilfered many Walmart executives in its ascendant period, and Jeff Bezos himself often cites Sam Walton’s Made in America as a key influence.
But it’s nonetheless worth breaking down their segments to better understand what we are comparing. Walmart’s most recent 10-K announced revenue of $681 billion in the fiscal year ending January 31, 2025, and 82 percent of that revenue comes from its U.S. operations. Walmart doesn’t break out its international operations by segment (they do so by country), but here’s the U.S. breakdown:
| Walmart US | Sam’s Club US | Total US Sales | Percentage of US Revenue | |
|---|---|---|---|---|
| Grocery | $276,003 | $59,976 | $335,979 | 60.26% |
| General Merchandise | $113,921 | $11,249 | $125,170 | 22.45% |
| Health and wellness | $62,092 | $6,089 | $68,181 | 12.23% |
| Fuel and Other | $10,399 | $12,924 | $23,323 | 4.18% |
| Membership | $2,594 | $2,323 | $4,917 | 0.88% |
| US Revenue | $465,009 | $92,561 | $557,570 | 100% |
As is evident here, Walmart is now basically a grocer with some other segments attached. If one takes these percentages to hold for their entire global operation, Walmart would have done about $410 billion in grocery sales, $265 billion in other retail, and $6 billion in membership fees. They don’t break down e-commerce sales abroad, but e-commerce as a whole accounts for about 16 percent of total US sales (this is not represented in the table above, as it is a share of individual segments and not its own category).
Amazon is predictably a more complicated beast.
| Amazon sales | Amount | Percentage |
|---|---|---|
| Online Stores | $247,029 | 38.72% |
| Physical Stores | $21,215 | 3.33% |
| Third-party Seller Services | $156,146 | 24.48% |
| Advertising Services | $56,214 | 8.81% |
| Subscription Services | $44,374 | 6.96% |
| AWS | $107,556 | 16.86% |
| Other | $5,425 | 0.85% |
| Total | $637,959 | 100% |
The National Retail Federation measures Amazon’s retail sales revenues by counting only the company’s revenues from its online and physical stores. To my mind, there is a good case to include Amazon’s third-party seller, advertising, and subscription services under retail revenue, as they are not simply separate segments of the business like AWS but completely dependent on the online retail platform. Amazon couldn’t spin off third-party selling as FedEx recently did to its Freight segment. Its “online store” is the source of its subscription revenues, its advertising revenues, and its third-party seller revenues. So a better comparison of Walmart to Amazon as competitors would be to use Amazon’s total revenue minus AWS, which was $530.4 billion in 2024. This represented 77.9 percent of Walmart’s total global revenue for the same year.
Three quick notes before continuing: 1) Amazon has not broken out its grocery sales in its 10-K’s yet, an indication that it is not yet a major player here. But with its recent announcement of same-day perishables delivery in 2,300 cities, it is trying to make a play. 2) Amazon Prime ($44 billion) is obviously huge compared to Walmart’s membership revenue (Walmart+ and Sam’s Club membership), but it’s a costly advantage (see below). 3) Walmart is also expanding into e-commerce, earning 16.4 percent of its sales (~$111 billion of their total revenue) from online sales. This is nothing to sneeze at, and there are some indications that they’ve finally figured out how to make their store-as-last-mile strategy work.
Physical footprints
According to CoStar, Walmart’s total square footage of commercial real estate is 958 million sq. ft., and Amazon’s (minus its data center real estate) about 735 million sq. ft. Given Amazon’s non-AWS revenue, $530 billion, and Walmart’s revenue of $681 billion, the two companies seem to be generating about the same amount of retail revenue with their US real estate: $710 (Walmart) and $720 (Amazon) per square foot per year.
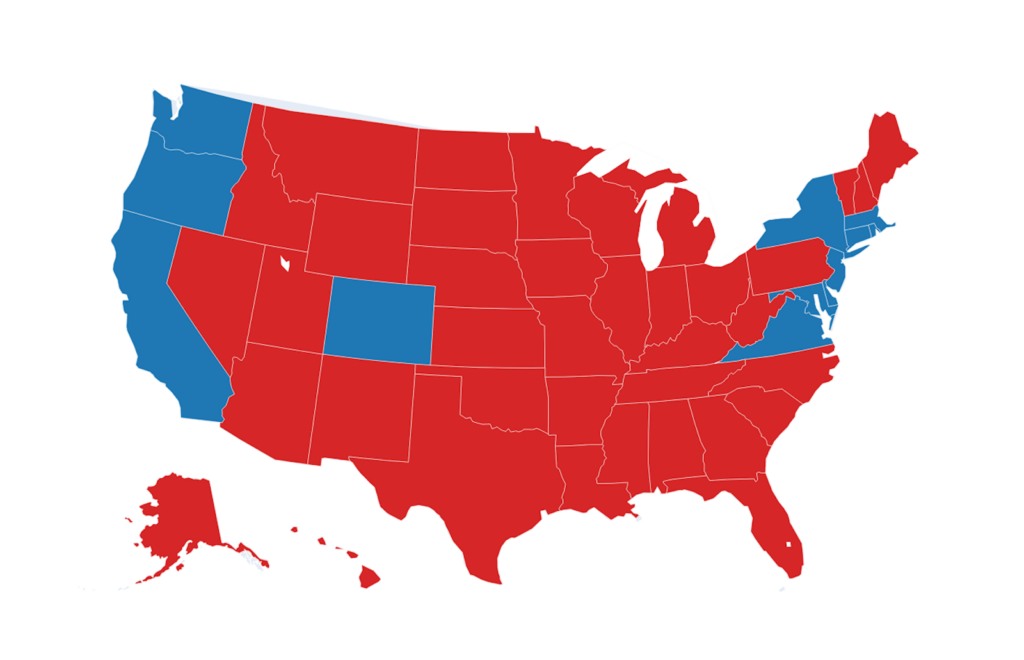
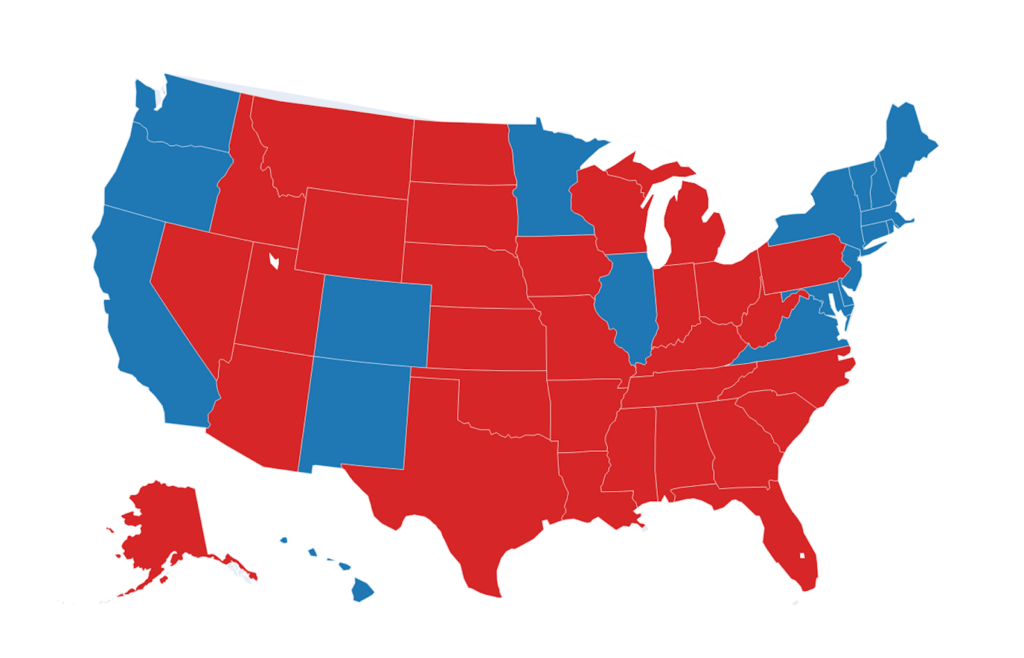
If you break it down by state, some interesting disparities between the companies’ physical footprints appear. In The Retail Revolution, historian Nelson Lichtenstein noted the “symbiotic” expansion of Walmart and the GOP during the neoliberal period, and today, with a few exceptions, Walmart has more commercial real estate in red states than blue states. Amazon, by contrast, has more in blue states than red states. In many cases, the disparity is quite stark: in California, Amazon has almost twice the square footage of commercial real estate as Walmart (91.5 million square feet to Walmart’s 53.8 million), whereas in Alabama, Walmart (24.2 million) has more than eight times the square footage of Amazon (2.7 million). Having more square feet in Alabama than New York (18.1 million), as Walmart does, would make zero sense from the perspective of Amazon, which has until recently built methodically around population concentration.
Let’s look at a state where the two companies have a pretty similar footprint: Arizona. Per CoStar, Walmart has 22.1 million square feet (146 total facilities) in Arizona, and Amazon uses 20.7 million square feet (59 total facilities), if you exclude its two data centers and One Medical facilities. It’s difficult to compare the real estate costs here directly, as Walmart mostly owns their facilities, and Amazon mostly rents them. But CoStar has useful “Market Asking Rent Per Area” data comparables for every property, listed as annual rent per square foot, which gives us a point of comparison. Using this data, I came to the following: if Amazon were paying market rent on its properties, it would be paying a bit more than $219 million per year. That number for Walmart is a little more than $437 million per year, confirming the intuitive idea that paying for warehousing space is going to be cheaper than retail space.
So far, so good for the E-commerce Advantage theory. But this is about as good as it is going to get. Right off the bat, the warehousing cost is more than we’re led to believe by the chart from Rodrigue above: there, warehousing costs for e-commerce should be 22.2 percent of rent costs for retail, but here it’s above 50 percent. Furthermore, Amazon tends to be more concentrated in states with more expensive commercial real estate (California as opposed to Alabama)—higher per-square foot real-estate costs for Amazon probably brings it closer to parity than the chart above from Rodrigue indicates.
Now there’s the labor question. It’s estimated that Amazon’s workforce in Arizona is about 40,000 people, and Walmart has a comparable 37,979 workers. According to Indeed.com, Walmart retail associates in Arizona start at somewhere between $16.25 and $17.58 an hour, while Amazon warehouse workers in the state start at somewhere between $18.42 and $19.18 an hour. This is a cursory analysis, but these numbers seem to indicate that Amazon’s labor costs are actually higher than Walmart’s in Arizona, despite having a similar physical footprint and workforce size there. Why would this be?
As a traditional retailer, Walmart has to pay for desirable locations. But while Amazon doesn’t need the same kind of location desirability for customers, it does need to build its warehouses close to the population centers it wishes to service. This means Walmart’s facilities are actually more remotely located on the whole than those of Amazon—think about the suburban highway loops around the smaller cities and towns where you tend to see Walmart stores. Of Walmart’s 146 facilities, 19 (13 percent) are in urban areas, 115 (79 percent) in suburban areas, and 12 (8 percent) in rural areas—according to Jed Kolko’s classification of zip code data. Of Amazon’s 59 facilities in Arizona, 26 (44 percent) are in urban areas, 32 (54 percent) in suburban areas, and 1 (2 percent) in a rural area. So while Amazon’s overall real estate costs are lower than those of Walmart, it’s drawing from a labor pool in more concentrated areas and paying (marginally) higher wages.
It is with rent and labor that the E-commerce Advantage theory is designed to shine. Amazon’s labor costs per employee, however, seem to be slightly higher than Walmart’s, and Amazon’s real-estate costs are much less cheap than what the chart above suggests. These labor costs don’t even include Amazon’s delivery workforce, which are entirely subcontracted out and so not included in the headcount comparisons here. Given all of this, the fundamentals of the E-commerce Advantage theory look pretty shaky.
The cost of free shipping
In Clash: Amazon vs. Walmart, Marketing professor Nirmalya Kumar of Singapore Management University argues the opposite thesis and claims that online retailing is actually a pretty substantial loser for Amazon. Kumar’s argument, relying on an analysis of Amazon’s 10-K, is as follows: Amazon’s delivery costs (fulfillment + shipping) are above 30 percent of total sales, and if you subtract AWS and other non-retail sales, they’re in fact above 40 percent of non-AWS sales. These costs together were $95.8 billion for shipping costs and $98.5 billion for fulfillment costs in 2024, or a total of $194.3 billion, on top of the costs of the goods themselves. Taking the retail industry norm of 25 percent gross margin (a number he gets from the example of Walmart), Kumar subtracts Amazon delivery cost percentage from the retail norm and arrives at the somewhat shocking conclusion that the gross margin for Amazon’s online retailing is substantially negative—by at least 15 percent and potentially much more as there may be other operating costs that the retail business relies on.
For all the helpful, detailed breakdown of some of the 10-K numbers, Kumar makes one questionable step in coming to this dramatic conclusion, which is simply to assume the industry-wide gross margin for retail as the standard of comparison. Walmart’s 2024 Cost of Sales was 75.9 percent of sales, so just less than that 25 percent gross margin that Kumar picks out. That same number for Amazon was 51.1 percent. On the surface, then, Amazon’s gross margin is much higher than that of Walmart, but digging a little deeper, it becomes apparent that Amazon breaks out its expenses in a way that makes a direct comparison with retail corporations impossible. Within typical retail “Cost of Sales” are included expenses like direct retail store labor, a marginal expense for Amazon. Meanwhile, counted outside of Amazon’s “Cost of Sales” are all “Fulfillment” expenses, including its payroll for Fulfillment Center workers. Clearly no direct porting of the typical retail gross margin to the case of Amazon is possible, and so Kumar’s strong conclusion that online retail is a substantial loser for the company does not hold up.
| Amazon | Walmart | |
|---|---|---|
| 2024 Sales (in millions) | $637,959 | $674,538 |
| 2024 Cost of Sales (in millions) | $326,288 | $511,753 |
| 2024 Cost of Sales as a % of Sales | 51.10% | 75.90% |
However, while Kumar seems to overstate his case, he is correct to doubt the profitability of Amazon’s retail business and helpfully picks out one very concerning trend in Amazon’s expenses. Since the introduction of Prime, Amazon’s cost of shipping has risen significantly as a share of overall revenues. He writes:
Between 2006 and 2022…, Amazon’s delivery costs as a percentage of its overall revenues have almost doubled from 17 per cent to 32.65 per cent, despite annual sales revenues increasing about fifty times…. What explains the dramatic change…? In a word: Prime. Before the introduction of Amazon Prime, which provides free unlimited deliveries for an annual subscription fee, shoppers had to pay a delivery fee with each order…. With Amazon Prime, subscriber behavior changed. Now, a shopper simply orders as the need arises, with no incentive to bundle the items.
Remember: delivery costs as a percentage of non-AWS sales is well above 40 percent. This is still true in 2024, despite the fact that Amazon has engaged in a broad regionalization plan to bring down shipping costs.
It’s therefore somewhat ironic that Bezos appears to have gotten the idea for Prime from Costco founder Jim Sinegal. Costco, with its tremendously low overhead and warehouse-as-store model, is in many ways an anti-Amazon in its retail structure. A Costco membership actually encourages bundling, as Costco shoppers take their membership to be proof that they’re getting the lowest prices on any particular item, and thus as reason to splurge. If you’re braving a trip to Costco (a personally harrowing but regular experience for me), you’re probably coming back with too much stuff. Amazon’s membership model, by contrast, encourages less spending per order, driving up Amazon’s back-end delivery costs and preventing economies of scale in shipping. Whereas Costco’s customers come into the warehouse, Amazon’s membership requires it to deliver goods out of the warehouse to its customers’ homes. The promise of Costco pertains to price; that of Amazon to speed and convenience. This locks in distribution expenses for Amazon that Costco always keeps way lower than that of its retail competitors.
On the other hand, thanks to that expenditure, Amazon now has its “competitive moat,” which it can use to be a uniquely positioned pharmacy, grocer, and parcel company. And it’s here that the comparison of e-commerce and traditional retail through the lens of Amazon and Walmart breaks down. In Amazon, clearly we are dealing with something much greater than an e-commerce company. Especially as it builds out its “Rural-Super Rural” distribution network, Amazon’s logistics infrastructure is looking much more like a public good in private hands—a common carrier of the 21st century.
Don’t write off brick and mortar
In the end, then, the most ready-to-hand examples of e-commerce and traditional retail are difficult to take as representative of their respective markets. No other companies in the US come close to half of their workforce sizes. Walmart so dominates the American food system that if you add up the revenue of Kroger, Albertsons, and Ahold Delhaize (Stop & Shop, Food Lion, Giant, and Hannaford), you’re still not scratching that of Walmart. These are incomparable corporate behemoths. As ex-Whole Foods Vice President Errol Schweizer recently told me, “With those two, it’s King Kong vs. Godzilla, and either way Tokyo’s fucked.”
| Company | 2024 Total Revenue |
|---|---|
| Kroger | $147 billion |
| Albertsons | $79 billion |
| Ahold Delhaize | $92 billion (approx.) |
| TOTAL | $318 billion |
Perhaps a more representative comparison is in fast fashion, where you have one retailer, Primark, that has famously resisted e-commerce altogether, and another, Shein, that is purely an e-commerce business. After getting understandably pummelled during the pandemic, Primark’s revenue has rebounded to $12.4 billion in 2024, compared to Shein’s estimated $38 billion. However, Primark’s adjusted operating profit of $1.48 billion in 2024 represented significant growth from the previous year of $991 million, while Shein’s net profit in 2024 was only $1 billion, a 40 percent shrinkage from the year before and well below its projected $4.8 billion. Neither company files a 10-K, but even if a more direct comparison were possible, it would be difficult to universalize claims about Shein’s model, as one of their big advantages until this year was tariff-free imports thanks to the now-closed de minimis loophole. Regardless, as Primark thrives and Shein struggles, I’m guessing that a more in-depth analysis of that case comparison would also cast skepticism on the E-Commerce Advantage theory.
Simple intuition tells us that giving consumers a much expanded product inventory to choose from and then delivering their purchases right to their doorstep is going to be a costlier endeavor than traditional retail. E-commerce does have certain advantages (lower rent, no additional retail store costs), but it also bears the formidable last-mile expense and necessarily pulls from a labor force close to population centers. I’d need to do many more comparisons along these lines to say definitively that e-commerce has a less profitable cost structure than traditional retail, but at the very least, it’s possible to say here that the E-commerce Advantage theory doesn’t hold up.
In his 2023 book Winner Sells All, journalist Jason Del Rey tells the story of Amazon and Walmart’s battle largely as one of Walmart lagging behind its trendier and more innovative competitor. Walmart, however, has continued to do just fine, its revenue increasing by more than $30 billion every year for the past five years on average. Meanwhile, the e-commerce share of retail has hovered stubbornly around 16 percent after jumping significantly with the Covid-19 pandemic. Until that starts to grow significantly, Del Rey’s narrative about the inevitable triumph of digital retail looks premature. Most Americans still do the lion’s share of their shopping in person, and that doesn’t look like it’s going to change any time soon. Perhaps what the German social theorist Theodor Adorno said in 1956 of the brick and mortar experience still holds true today:
You just have to walk through one of the so-called American supermarkets, one of the huge stores that are especially characteristic of the new large cities and centers of the West, and you will have the—however deceptive and superficial—feeling: the time of privation is over, it is the boundless and complete satisfaction of material needs as such.
Filed Under