

This post was originally published on this site.
My Neighborhood News Group (MNNG) is publishing a series of stories on how local governments are funded and the financial challenges facing both elected officials and residents. You can read Part 1: Introduction here. Part 2: Where’s the money here. Part 3: Property taxes here. Part 4: Fees and taxes here. Part 5: Federal and state grants here. Part 6: The difference between wants and needs here. Part 7: The color of money here. Part 8: ‘Cities should function more like a business’ here. Part 9: What local governments are up against in 2026 here.
“Is there one place we can go to get the full list of itemized taxes how much we pay and to whom it goes – like you have listed for your property?” — My Edmonds News comment section, Dec. 10, 2025
Government is complex. It’s reasonable to say that only financial experts are willing, able or even want to read the fine print spreadsheets. That doesn’t mean residents shouldn’t know where the government gets money and what it is spent on.
Let’s start with the general fund.
The general fund is the operating budget. It pays for everything that it takes to keep a local government working and doing its daily business — from courts to cops, software to salaries, paperclips to pool chemicals.
The general fund primarily comes from property tax, sales tax, fees and fines, and grants. Every local government has a different mix based on its population and economic mix.
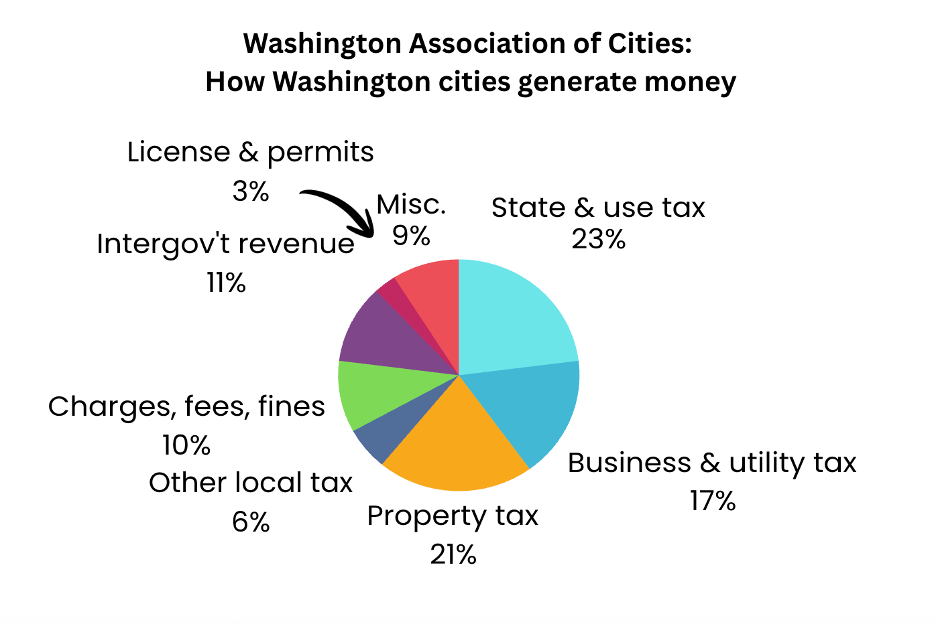
Most people understand pie charts. So that’s what we have here. For the entire state of Washington, this is generally – and proportionally – how local governments fund government:
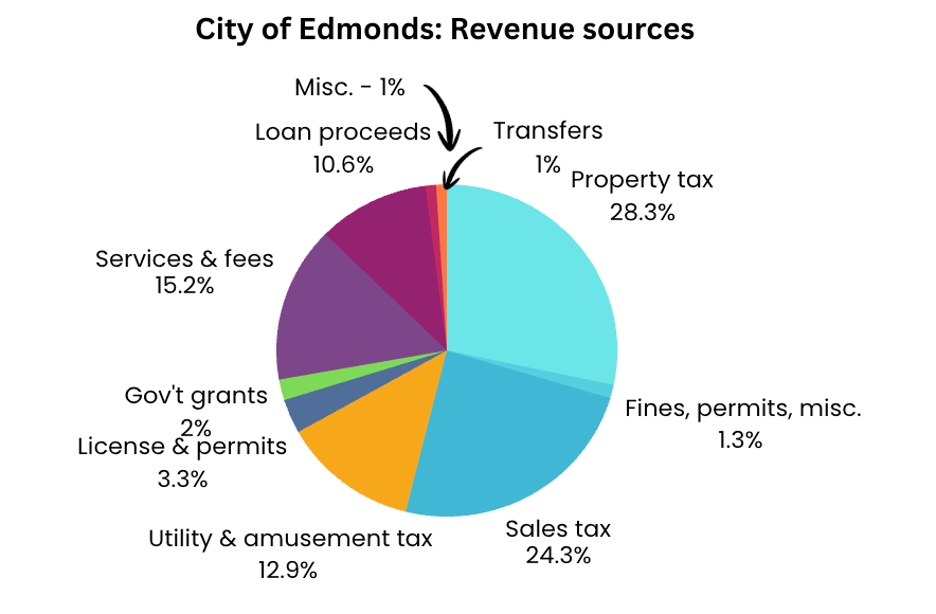
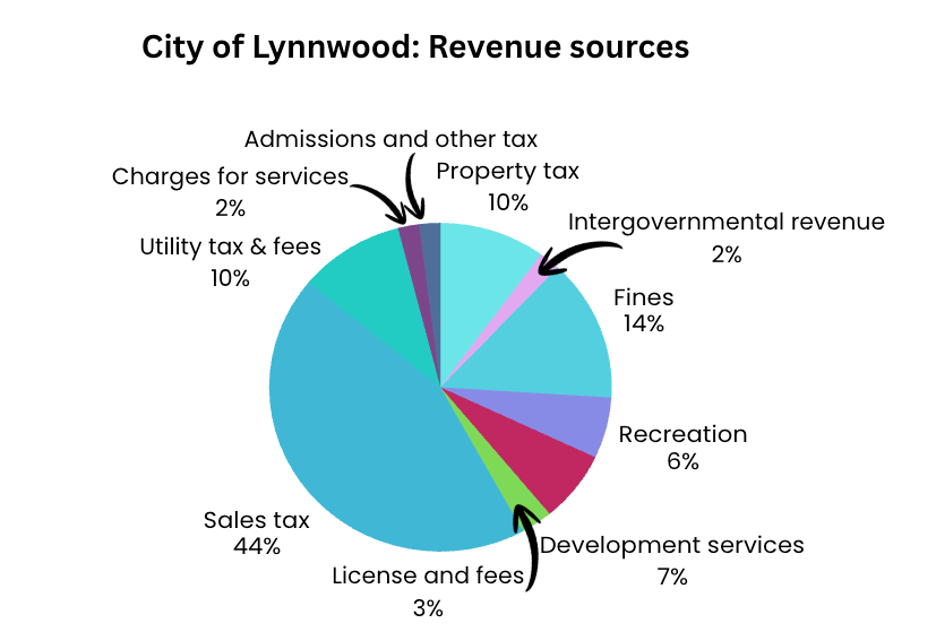
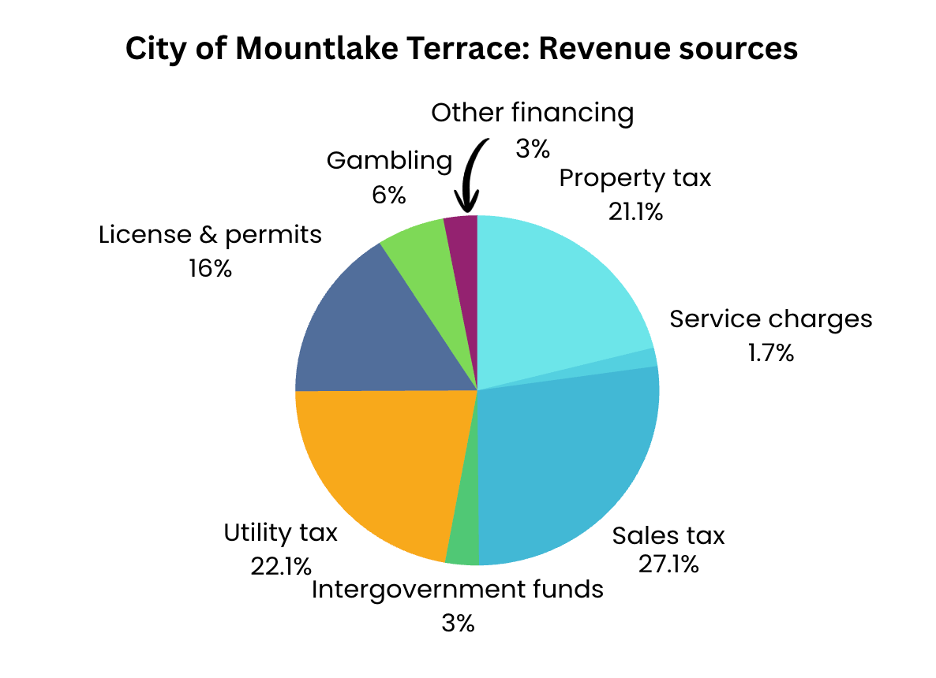
And here are revenue sources for three of the cities in our coverage area:
Property Tax
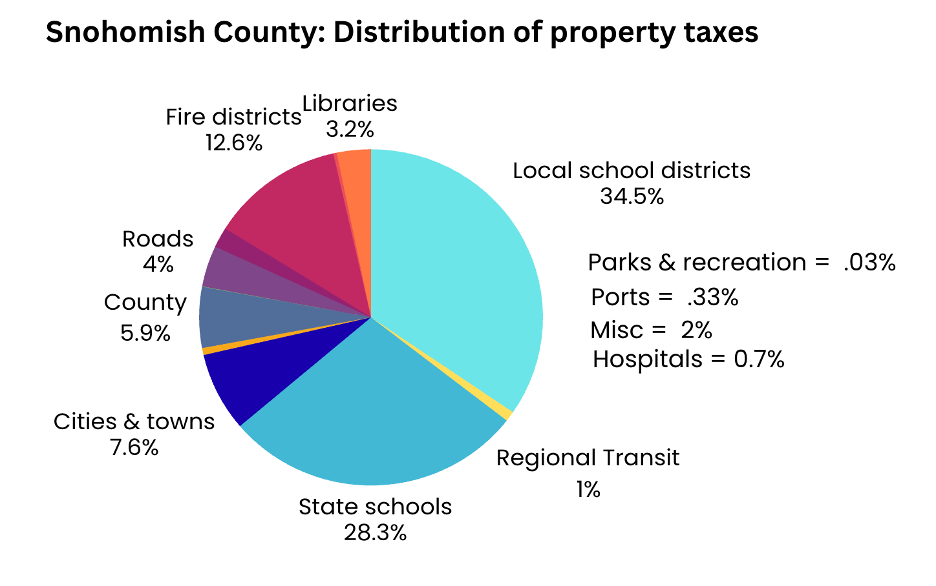
Most people are concerned about property tax and how much of those tax dollars go to various local projects and programs.
Here’s the surprise. Most property tax – 63% – goes to the state and local education system.
Proportional pies look big. When the pie pieces become actual dollars or parts of dollars, a different story comes into view.
“The biggest misunderstanding about city finance is that cities receive all of the homeowner’s property taxes,” said Mountlake Terrace City Manager Jeff Niten. “The average homeowner in Mountlake Terrace has a $4,706 property tax bill. Only $374 goes to the city general fund. “
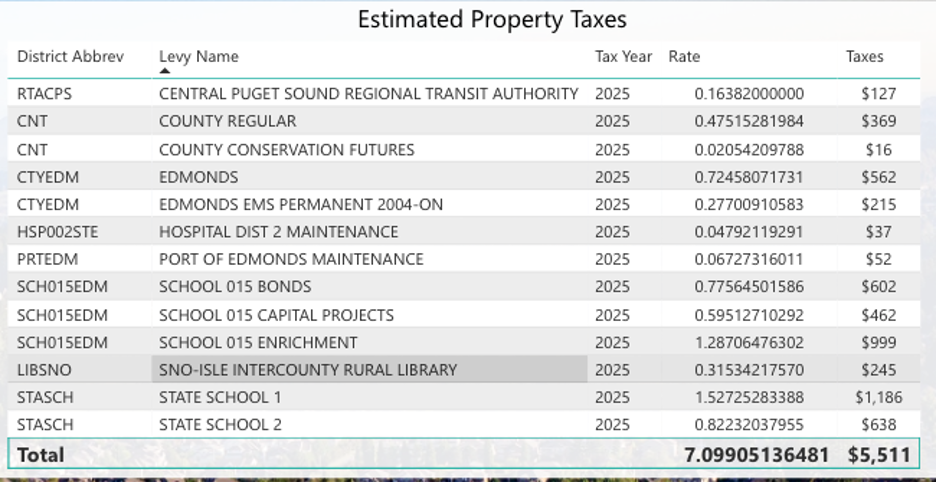
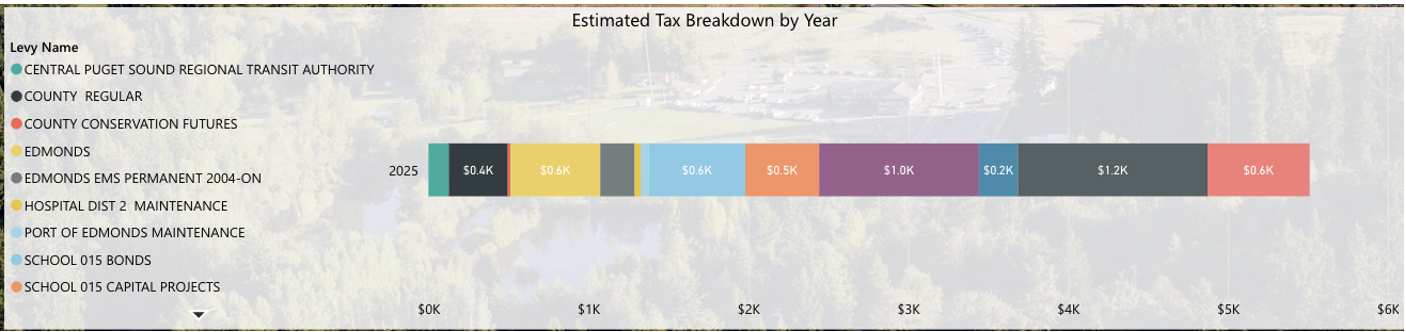
In Edmonds, a $776,000 house pays $5,511 in total property tax. About $560 goes to the City of Edmonds.
In Lynnwood, a $685,000 house pays $5,367 in total property tax. About $460 goes to the City of Lynnwood.
Remember when we talked about the 1% increase in property taxes that go to the city? In this hypothetical house price scenario, that 1% represents $374 (Mountlake Terrace), $560 (Edmonds) and $460 (Lynnwood). That’s why 1% doesn’t generate that much money and cities look to levies or additional taxes.
Think about the variety of services provided, in part, by property taxes — emergency response, courts, clean parks, functioning signals. Private companies won’t do that. It’s not profitable.
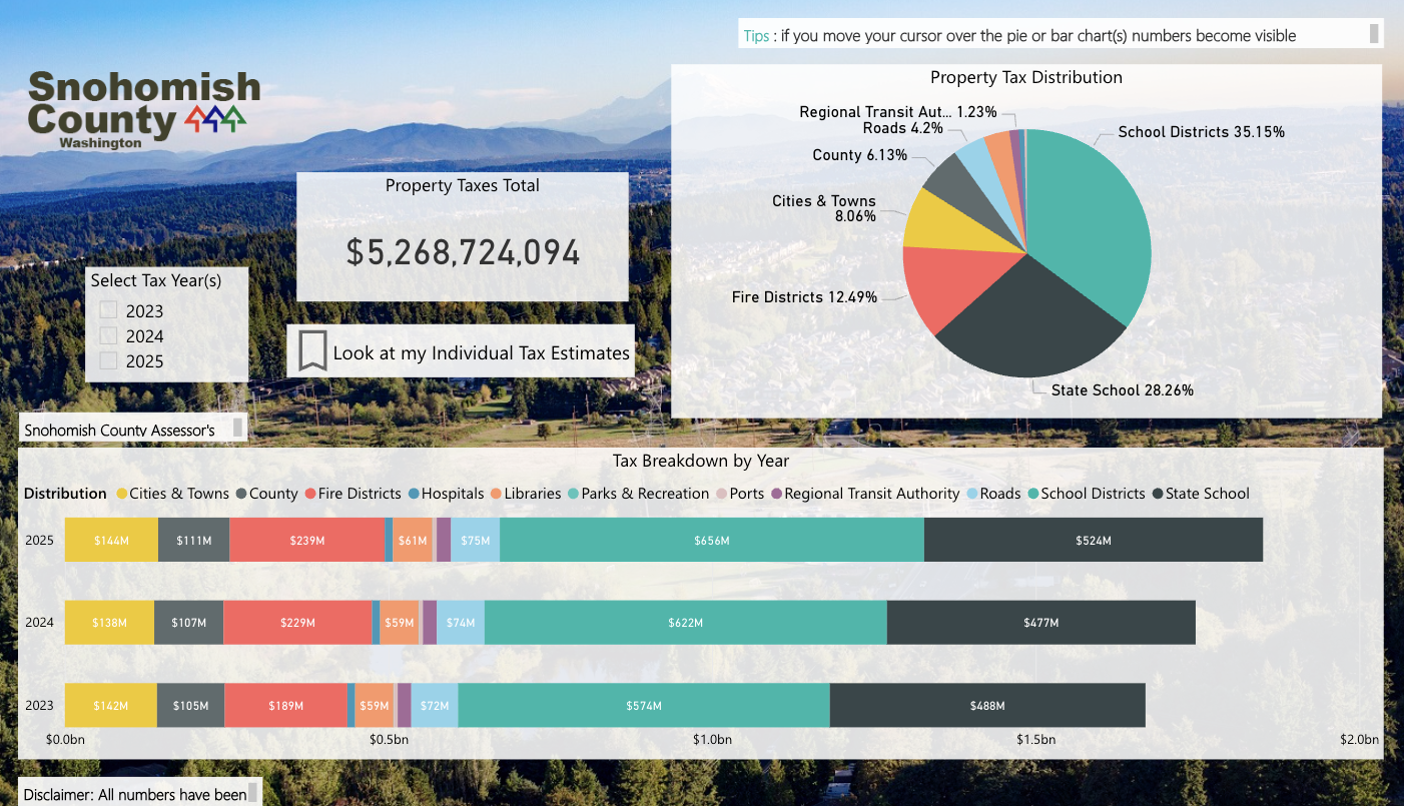
You can see where your property tax dollars go on the Snohomish County Assessor’s website. There, you can look up your address to get your parcel number. When you put in your parcel numberr, there is a breakdown of every property tax dollar and where it goes.
In Edmonds, here’s what it looks like:
Snohomish County
For every dollar in property tax, Snohomish County gets 6 cents. The other 94 cents go to other important public service providers – schools, fire districts, cities and towns, libraries and more. For more on that breakdown, see the Assessor’s tax distribution page.
In Edmonds, in 2025, for every property tax dollar paid, the City of Edmonds receives 14 cents. “To put it in perspective, for every $10 million the City receives in property tax revenue, a 1% increase amounts to just $100,000,” a City of Edmonds spokesperson said.
For every property tax dollar in Lynnwood, Lynnwood gets 6 cents.
“With that, we have been able to provide vital services to our community while improving our infrastructure to meet the demands of the significant and rapid growth in our region,” said a City of Lynnwood spokesperson. “Every City service provided by Lynnwood is important to someone.
“Lynnwood is a full-service city, we are a big – little city, we are a hub city, we have visitors and commuters constantly in our city and that puts pressure on our city services as well,” he continued. “We believe community members want a balanced city that is safe, well maintained, has nice and clean parks and open spaces and a variety of businesses.”
Sales tax
Sales tax also generates money for the general fund. For Lynnwood, it generates the most money for the city’s general fund.
“Our community is an economic hub in Snohomish County, which means we understandably rely heavily upon sales tax,” the City of Lynnwood spokesperson said.
“While Lynnwood represents only 5% of the population of all cities in Snohomish County, Lynnwood generates over 20% of the sales tax for all Snohomish County cities,” he added.“While this is a boon during strong economic times, it can be reactive to national pressures and can swing greatly.”
Other local governments factor in sales tax and also watch it closely.
Utility tax
Utility taxes are another source of revenue.
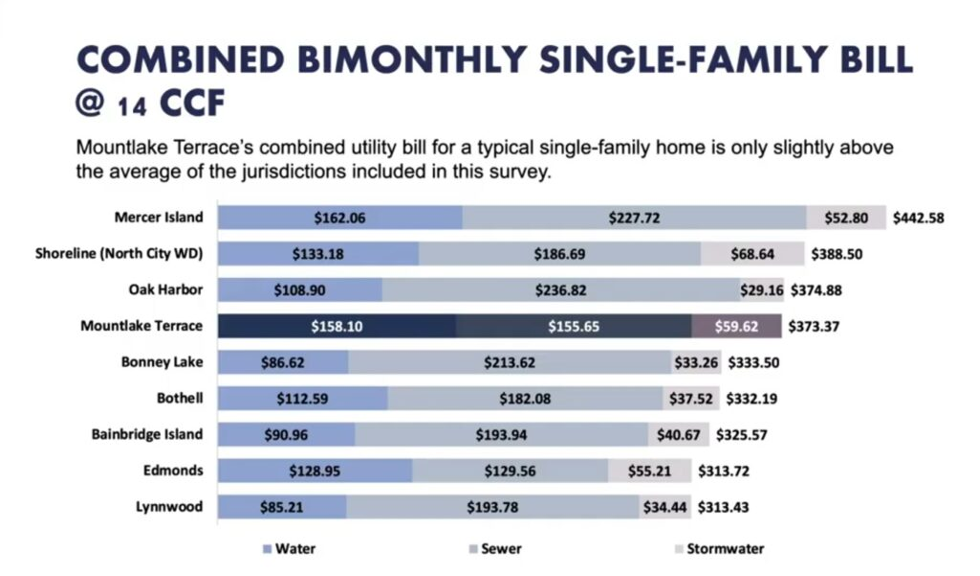
Edmonds, Mountlake Terrace and Lynnwood rely on Olympic View Water and Sewer for water, sewer and stormwater systems. Currently, the service cost for these cities is somewhere in the middle compared to other local jurisdictions. The bill includes a basic charge, plus a $50 base charge, plus a variable usage charge. Each city configures its bill slightly differently. This chart shows how much local residents pay on average.
My MLT News reporter Nick Ng did a deep dive on utilities in October.
Each city can tax the gross bill.
In December, Edmonds passed an ordinance to increase the tax from 10% to 20% of the entire bill to generate $3.2 million in 2026. That works out to about 6% of the total city budget and about $13 per month for the average property. Not as high as sales tax or property tax, but every dollar counts for both the city and the residents who have to pay the increased costs.
State shared revenues
Cities also get a piece of shared revenues. These are taxes collected by the state which are then returned to the cities. Shared revenues come from a variety of taxes including the state liquor tax, the cannabis tax, some sales taxes and some gas taxes. It makes up a small portion of city revenue and the city has no control over it.
The following data is from the Association of Washington Cities:
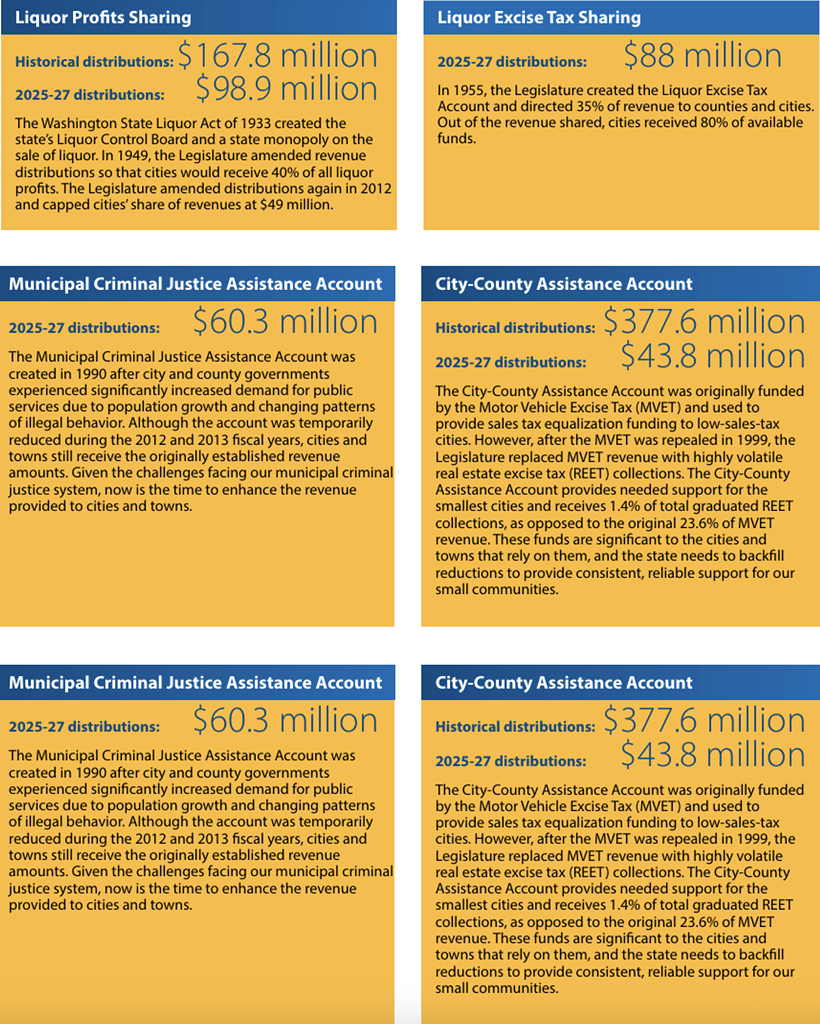
As noted earlier, the Association of Washington Cities said it is currently in a “defensive posture” with shared revenues. That means it is arguing local governments should continue to keep their portion of shared revenues and possibly get more even if the state is having its own money troubles.
Next: How local governments spend your money.